> For the complete documentation index, see [llms.txt](https://help.glpi-project.org/llms.txt). Markdown versions of documentation pages are available by appending `.md` to page URLs; this page is available as [Markdown](https://help.glpi-project.org/glpi-12/welcome-to-glpi-12/dahsboard.md).

# Dahsboard

GLPI dashboards allow real-time visualization of ITSM data to manage support activities and IT assets.

* **Customizable charts**: Dynamize tracking with a wide variety of display formats (pie charts, bar charts, line graphs, heat maps, or simple numerical counters).
* **Advanced filters**: Precisely target data by period, entity, group, category, or ticket status to obtain tailored indicators.
* **Adapted views**: Organize your tiles by drag-and-drop to create business dashboards dedicated to technicians, service managers, or management.

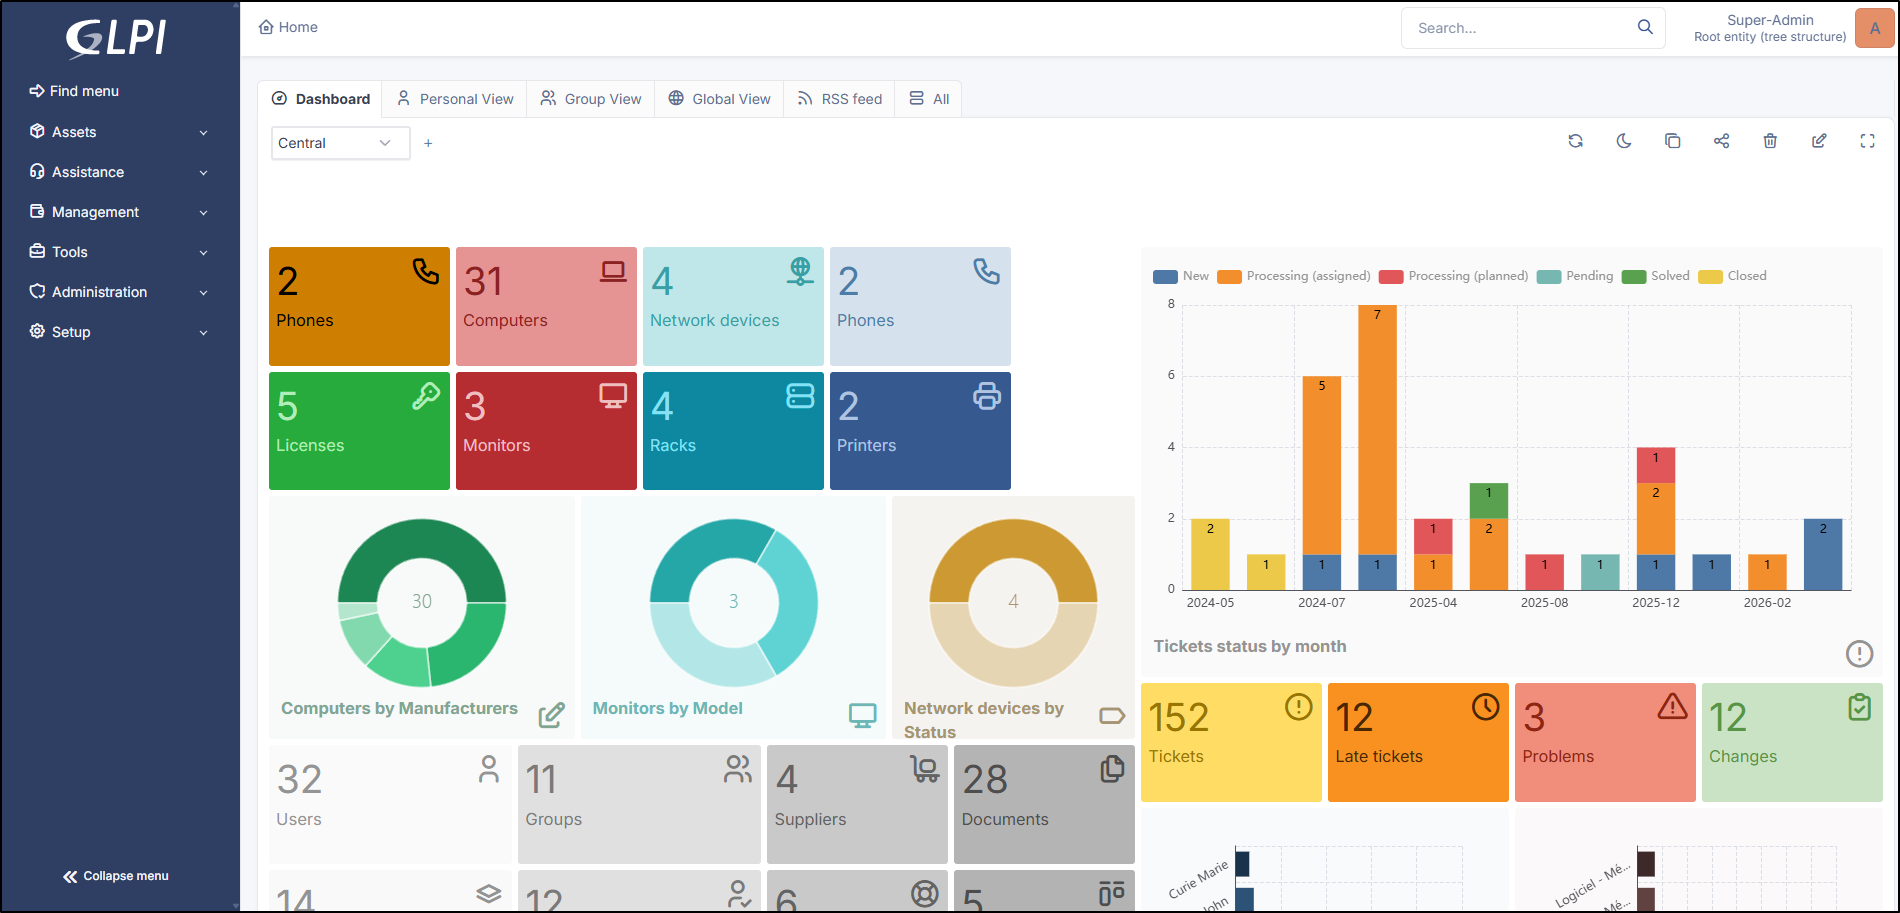
<figure><img src="https://304570660-files.gitbook.io/~/files/v0/b/gitbook-x-prod.appspot.com/o/spaces%2Fuys4bnfAs7Oe2yWUUh3p%2Fuploads%2Fgit-blob-edeacba46f45f7db6bd16f4aa9a1f4b77cbad4ec%2Fdashboard-view.png?alt=media" alt=""><figcaption><p>Dashboard view</p></figcaption></figure>

By default, 3 dashboards are created:

* **Central**: Includes some data from the IT assets and support.
* **Asset**: Dedicated to inventory data.
* **Support**: Dedicated to support data.

These dashboards can be modified or deleted according to your needs.

***

## Create a dashboard

* Click the <i class="fa-plus">:plus:</i> icon next to the dropdown list.
* Enter a name and click **`Add`**.
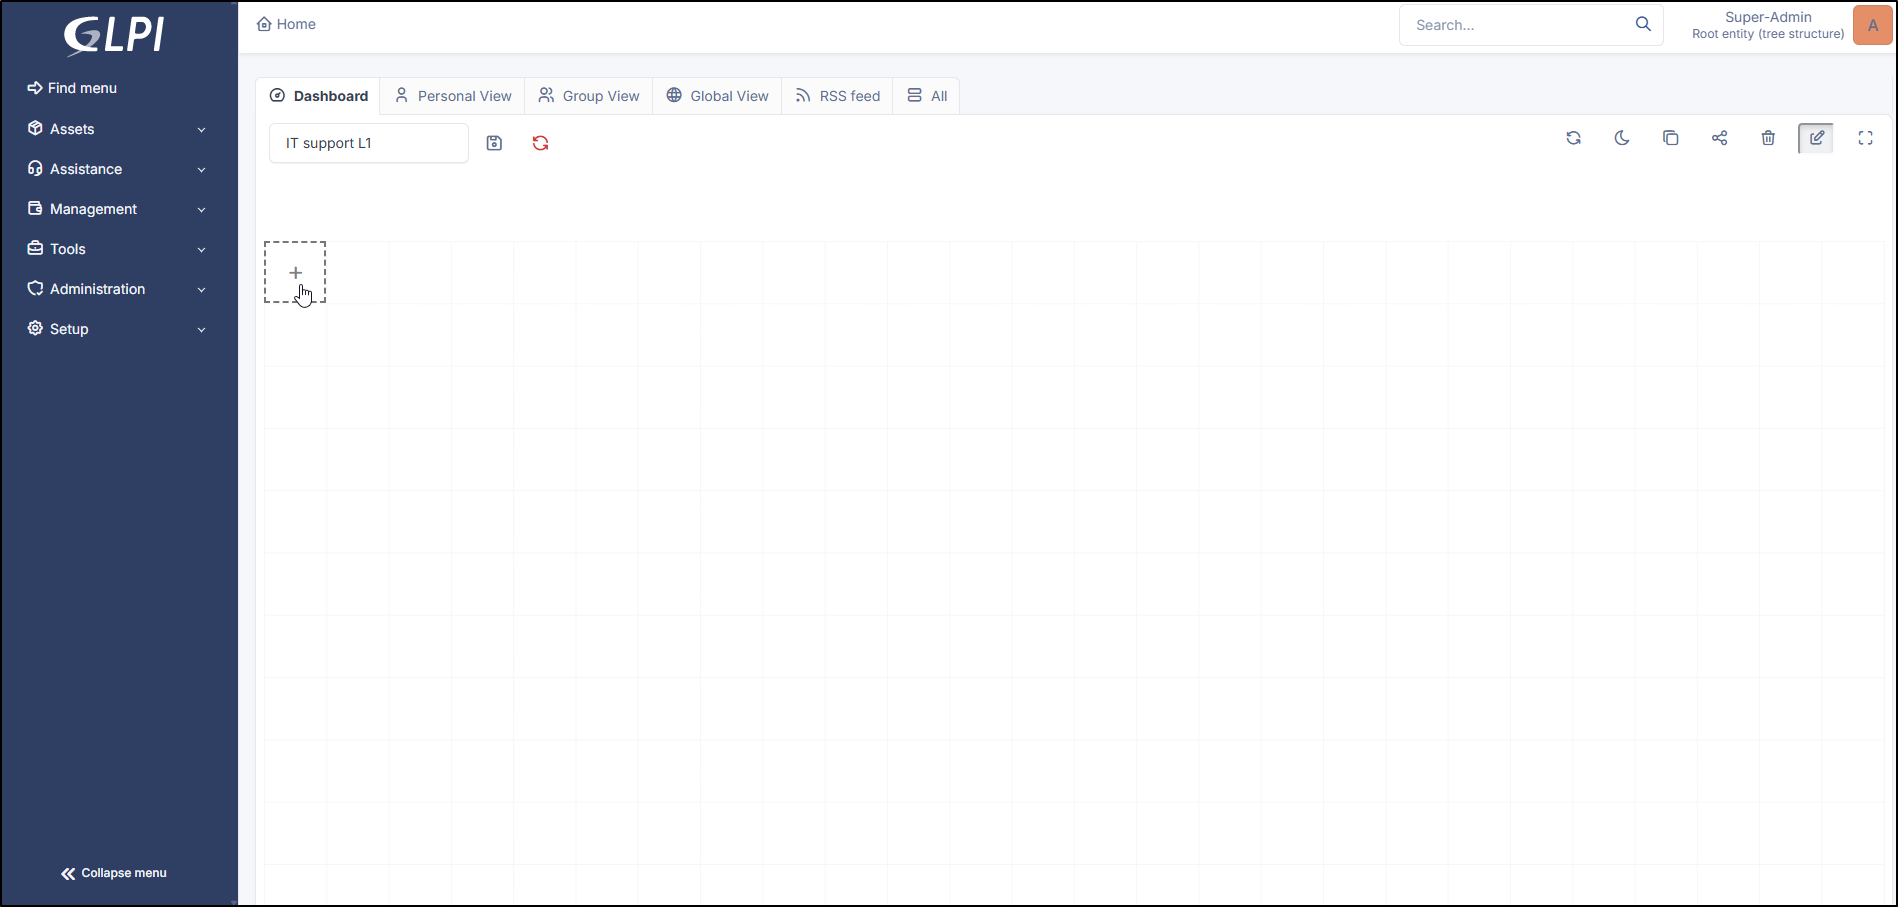
* The dashboard immediately enters edit mode. Click the <i class="fa-plus">:plus:</i> icon in the workspace to add a tile.

<figure><img src="https://304570660-files.gitbook.io/~/files/v0/b/gitbook-x-prod.appspot.com/o/spaces%2Fuys4bnfAs7Oe2yWUUh3p%2Fuploads%2Fgit-blob-7215e8e46e24d7abc5e88c86b29b8b8d1c0d0006%2Fdashboard-add.png?alt=media" alt=""><figcaption><p>Add a tile</p></figcaption></figure>

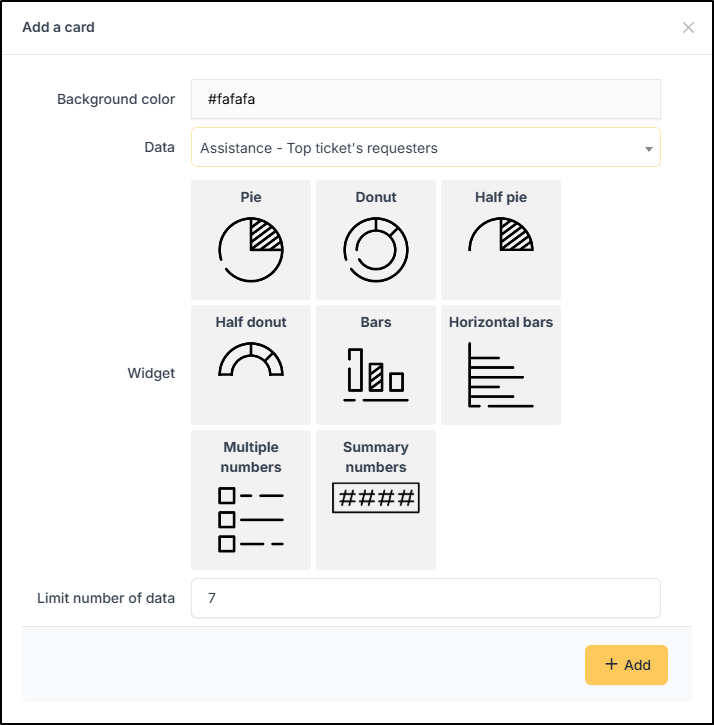
* Select the tile color using the predefined colors or the color picker.
* Select the type of data to display. Depending on the data, several widgets will be offered. An option allows you to limit the number of data points.

<div align="left"><figure><img src="https://304570660-files.gitbook.io/~/files/v0/b/gitbook-x-prod.appspot.com/o/spaces%2Fuys4bnfAs7Oe2yWUUh3p%2Fuploads%2Fgit-blob-522a65b62a2c6a690e12094d7fed41784e9db22f%2Fdashboard-widget.png?alt=media" alt="" width="536"><figcaption><p>Widget's list</p></figcaption></figure></div>

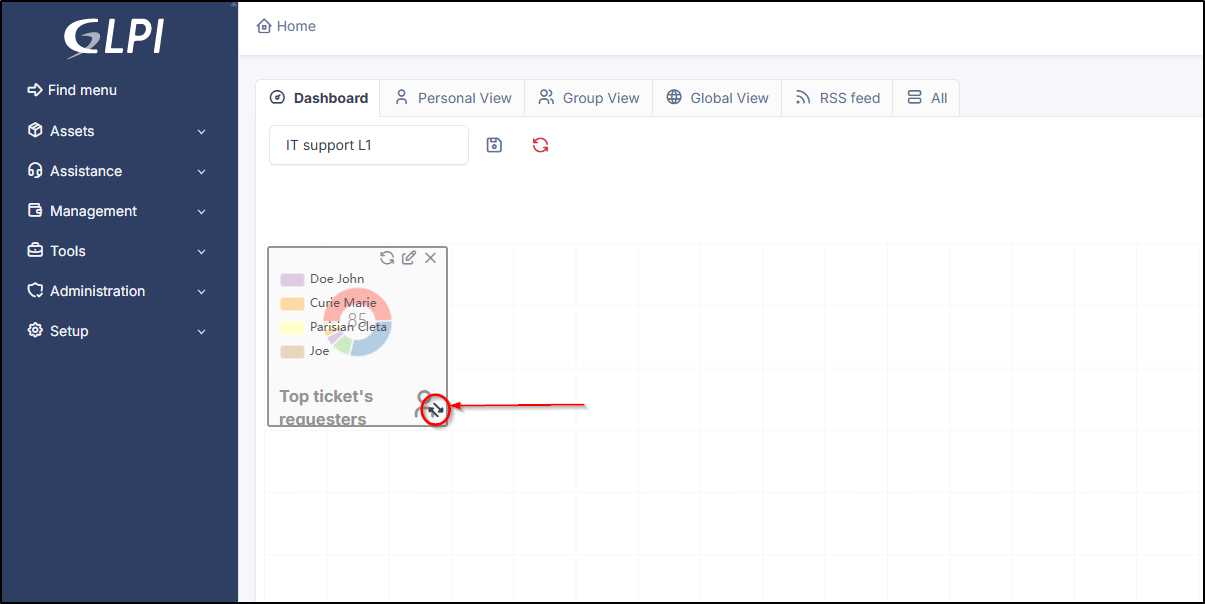
* The icon <img src="https://304570660-files.gitbook.io/~/files/v0/b/gitbook-x-prod.appspot.com/o/spaces%2Fuys4bnfAs7Oe2yWUUh3p%2Fuploads%2Fgit-blob-0d14ea4fb983cc3d8166afd8ebbf923a20311f28%2Farrows-double-nw-se%20(1).png?alt=media" alt="" data-size="line">allows you to resize the tile.

<figure><img src="https://304570660-files.gitbook.io/~/files/v0/b/gitbook-x-prod.appspot.com/o/spaces%2Fuys4bnfAs7Oe2yWUUh3p%2Fuploads%2Fgit-blob-7ea8a6d84b6d2aae31bff844536d24ebb0e185b8%2Fdashboard-dimension.png?alt=media" alt=""><figcaption><p>Resize a widget</p></figcaption></figure>

* Once your dashboard is complete, click the save icon <i class="fa-floppy-disk">:floppy-disk:</i> next to your dashboard's name.

### Tile options

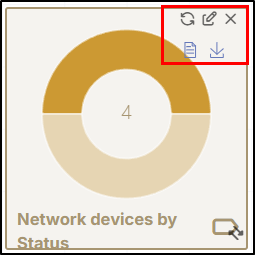
In edit mode, there are several options for modifying your tiles.

<div align="left"><figure><img src="https://304570660-files.gitbook.io/~/files/v0/b/gitbook-x-prod.appspot.com/o/spaces%2Fuys4bnfAs7Oe2yWUUh3p%2Fuploads%2Fgit-blob-0be1161fa29f8e0e3d0e7067e526e2ef8fc5399b%2Fdashboard-tile-options.png?alt=media" alt=""><figcaption></figcaption></figure></div>

<table><thead><tr><th width="91">Icon</th><th>Action</th></tr></thead><tbody><tr><td><i class="fa-arrows-rotate-reverse">:arrows-rotate-reverse:</i></td><td>Refresh the data</td></tr><tr><td><i class="fa-pen-to-square">:pen-to-square:</i></td><td>Edit the tile</td></tr><tr><td><i class="fa-x">:x:</i></td><td>Close the modifications</td></tr><tr><td><i class="fa-page">:page:</i></td><td>display the data</td></tr><tr><td><i class="fa-download">:download:</i></td><td>Download the image</td></tr></tbody></table>

### Widget options

If you click the edit icon, several options will be offered for modifying your widgets.

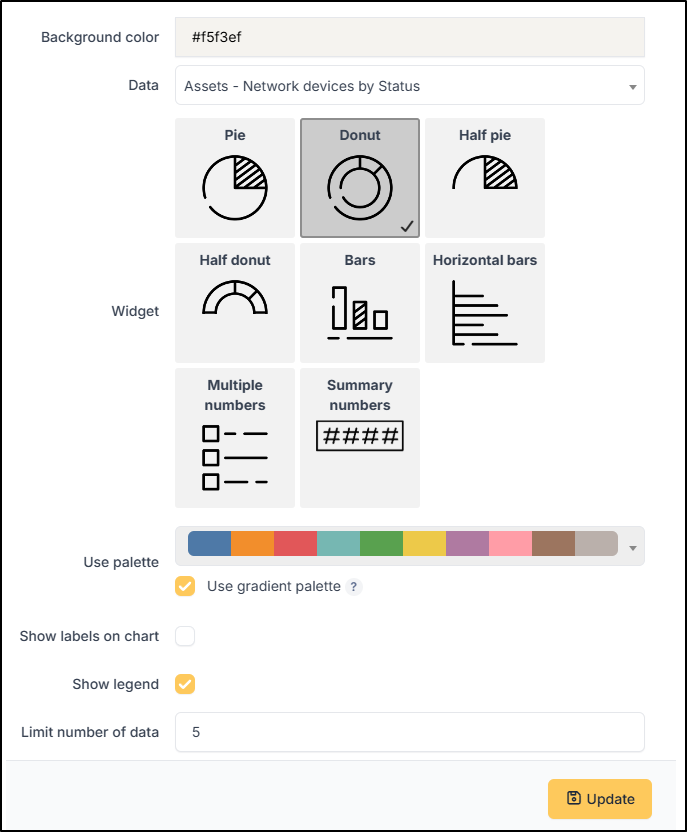
<div align="left"><figure><img src="https://304570660-files.gitbook.io/~/files/v0/b/gitbook-x-prod.appspot.com/o/spaces%2Fuys4bnfAs7Oe2yWUUh3p%2Fuploads%2Fgit-blob-e53651c422f97cf6ab73a2376beadac2b201450e%2Fdashboard-widget-options.png?alt=media" alt="" width="515"><figcaption><p>Widget options</p></figcaption></figure></div>

* **Background color** : change the dashboard tile color
* **Data** : change the data type
* **Widget** : change the type of the widget
* **Use palette** **or gradient palette** : Select a palette from the provided list or use a palette generated from the background
* **Display value labels on points/bars** : for bar charts only
* **Show labels on chart** : Display information on the chart; used for pie charts for example
* **Show legend** : displays the legend corresponding to the widget's colors
* **Limit number of data** : limit the amount of data displayed to avoid unreadable charts and excessive loading times

***

## Action Bar

The action bar at the top right allows you to modify, copy, or share your dashboards. This option is accessible if you have the corresponding permission. Refer to the profile section for more information.

<a href="/glpi-12/administration/profiles/configurationtab.md" class="button secondary" data-icon="address-card">View profiles</a>

<table data-search="false"><thead><tr><th width="136" align="center">Icon</th><th>Action</th></tr></thead><tbody><tr><td align="center"><i class="fa-arrows-rotate-reverse">:arrows-rotate-reverse:</i></td><td>Enables automatic refresh</td></tr><tr><td align="center"><i class="fa-moon">:moon:</i></td><td>Activates dark mode for dashboards</td></tr><tr><td align="center"><i class="fa-copy">:copy:</i></td><td>Duplicate dashboard</td></tr><tr><td align="center"><i class="fa-share-nodes">:share-nodes:</i></td><td>Share dashboard</td></tr><tr><td align="center"><i class="fa-trash-can">:trash-can:</i></td><td>Move dashboard to trash</td></tr><tr><td align="center"><i class="fa-pen-to-square">:pen-to-square:</i></td><td>Edit dashboard</td></tr><tr><td align="center"><i class="fa-expand">:expand:</i></td><td>Set dashboard to full screen</td></tr></tbody></table>

***

## Filters

Filters allow you to refine all the charts on a dashboard without changing their original configuration. This makes it possible to switch from a global view to a highly targeted analysis.

* **Time filtering**: Adjust indicators on rolling periods (last 7 days, current month, year) or define custom dates to analyze trends.
* **Organizational filtering**: Isolate data by entity (for multi-company/site environments), by technician group, or by requester.
* **Business criteria filtering**: Segment reports by ticket category (incidents, requests), status (in progress, pending, closed), or priority/urgency level.

A single dashboard can be used by an entire team. A service manager, project manager, or technician can apply their own filters to get the exact view they need.

Example:

An IT service director might have a global dashboard for the support section (number of tickets in progress, number of overdue tickets, etc.) but have a filter to display the details of a specific department (infrastructure services, level 1 support, etc.) to obtain customized indicators for those departments.

### Add a filter

* Select the desired dashboard from the dropdown list.
* Enter edit mode using the corresponding icon <i class="fa-pen-to-square">:pen-to-square:</i>.
* Click **`Add a filter`**.
* Select the desired filter.

<figure><img src="https://304570660-files.gitbook.io/~/files/v0/b/gitbook-x-prod.appspot.com/o/spaces%2Fuys4bnfAs7Oe2yWUUh3p%2Fuploads%2Fgit-blob-2ddc840df68637bae9253b1f1ed80a15f7bf9e12%2Fdashboard-add-filter.png?alt=media" alt=""><figcaption></figcaption></figure>

### Remove a filter

* Select the desired dashboard from the dropdown list.
* Enter edit mode using the corresponding icon <i class="fa-pen-to-square">:pen-to-square:</i>.
* Click the delete icon <i class="fa-trash-can">:trash-can:</i>.

### List of filters

* [Creation Date](#user-content-fn-1)[^1]
* [Last Modification](#user-content-fn-1)[^1]
* ITIL Categories
* Locations
* Manufacturers
* SLAs
* Item Status
* Ticket Types
* Group / Requester Group
* Technician Group / Assigned Group
* Technician
* Assigned User
* Ticket Status
* Entity

***

## Share a dashboard

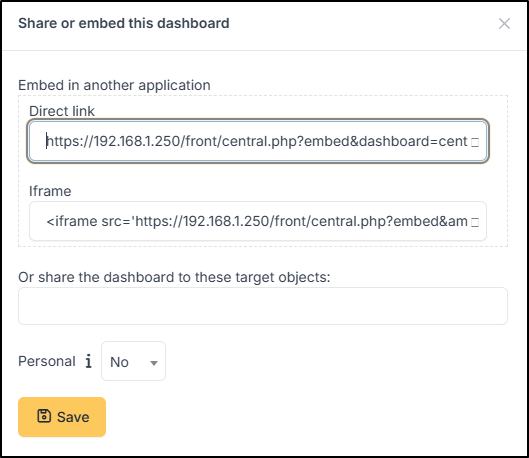
The share icon <i class="fa-share-nodes">:share-nodes:</i> available in the action bar allows for several types of sharing.

<div align="left"><figure><img src="https://304570660-files.gitbook.io/~/files/v0/b/gitbook-x-prod.appspot.com/o/spaces%2Fuys4bnfAs7Oe2yWUUh3p%2Fuploads%2Fgit-blob-3bbeef9f79b7fa53e9c1254bdd3064b2b4c88eb8%2Fdashboard-share.png?alt=media" alt=""><figcaption><p>Share a dashboard</p></figcaption></figure></div>

* **Direct link**: This option allows anyone with the link (and access to the subnet where the GLPI server is located if it's not available from the internet) to access the shared dashboard.
* **Iframe**: Generates a link to embed a GLPI dashboard into another website, for example.
* **Share with targets**: Share a dashboard with profiles, entities, users, or groups.
* **Personal**: This option makes a dashboard visible only to yourself. Other administrators will not see it either unless you explicitly share it.

[^1]: This option displays a date selector allowing you to pre-select the last 7 days, the last 30 days, etc., or to select a custom date.


---

# Agent Instructions
This documentation is published with GitBook. GitBook is the documentation platform designed so that both humans and AI agents can read, navigate, and reason over technical content effectively. Learn more at gitbook.com.

## Querying This Documentation
If you need additional information that is not directly available in this page, you can query the documentation dynamically by asking a question.

Perform an HTTP GET request on the current page URL with the `ask` query parameter, and the optional `goal` query parameter:

```
GET https://help.glpi-project.org/glpi-12/welcome-to-glpi-12/dahsboard.md?ask=<question>&goal=<endgoal>
```

`ask` is the immediate question: it should be specific, self-contained, and written in natural language.
`goal` is optional and describes the broader end goal you are ultimately trying to accomplish on behalf of the user. GitBook uses it to tailor the answer towards what is most useful for that goal.

The response will contain a direct answer to the question and relevant excerpts and sources from the documentation.

Use this mechanism when the answer is not explicitly present in the current page, you need clarification or additional context, or you want to retrieve related documentation sections.